

Visualizing the surface#
Cratermaker can export the surface mesh to a VTK file, which can be visualized with tools like PyVista and ParaView. In this example, we will emplace a 500 km crater on the Moon at a location of 60° N, 45°E, and then visualize the surface mesh using Pyvista.
The simulation will generate several files in a folder called surface, including grid.nc and surf000000.nc. When exported to vtk format, a file called surf000000.vtp will also be placed in the export folder. In this example, the simulation only contains one interval, so only one file is created (see Simulation for how to run multi-interval simulations).
We can then open up the mesh in PyVista for visualization
import cratermaker as cm
sim = cm.Simulation(gridlevel=6)
sim.emplace(diameter=500e3, location=(45,60))
sim.show3d(variable_name="face_elevation")
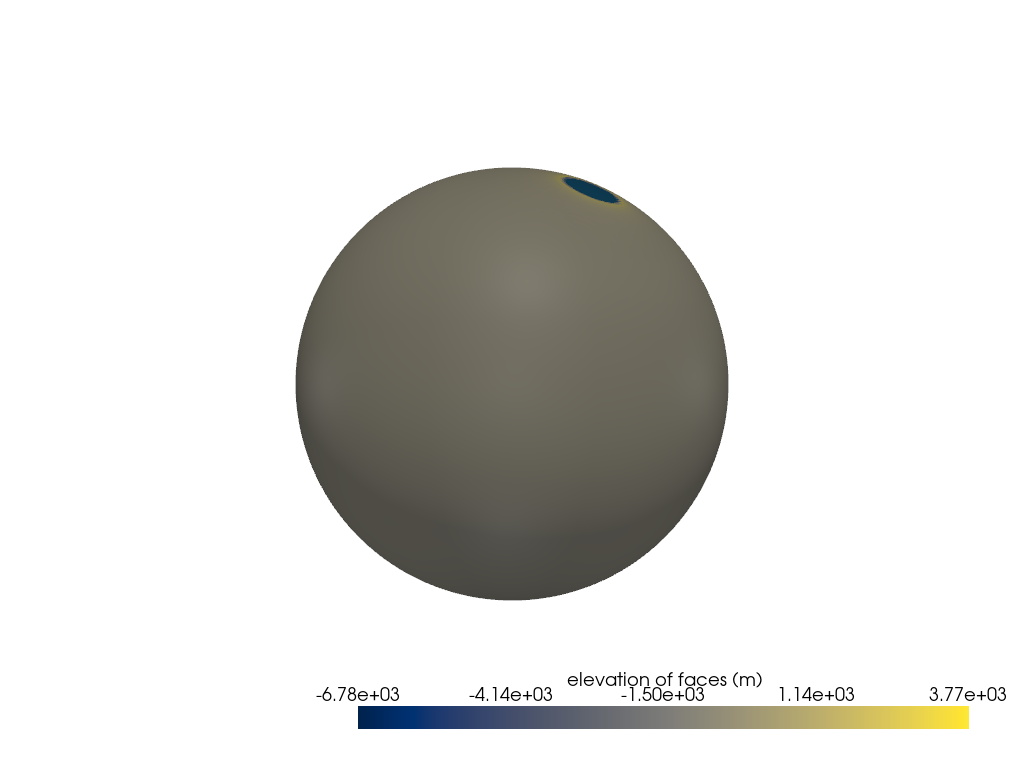
Using show3d to visualize the surface mesh.
Exporting data#
If you have old simulation data that you want to visualize it, you can make use of the Simulation.export() method. This method allows for exporting component data into multiple different formats, including “VTK’, “GeoTIFF”, “GPKG”, “Esri Shapefile”, and more, depending on the component.
For instance, to export the surface mesh to a VTK file that can be opened up with other visualization tools, like ParaView.
sim.export(driver="VTK")
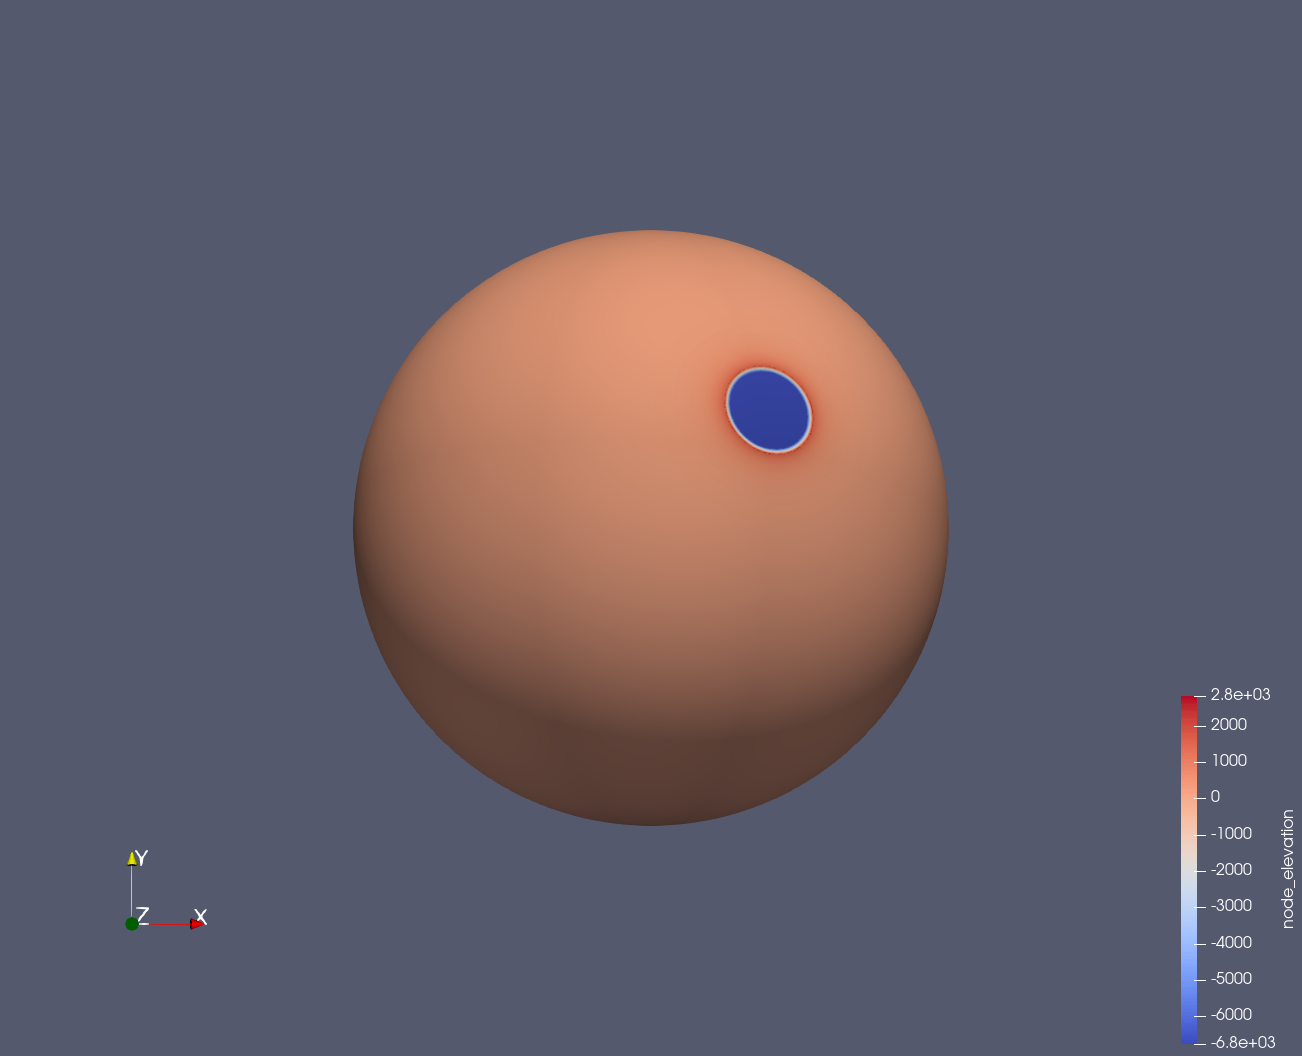
ParaView can be used to visualize the surface mesh, and also to create animations of the surface evolution. For more information on how to use ParaView, see the ParaView documentation.
Exporting multi-interval data#
By default, Simulation.export() will only export the most recent interval in a multi-interval run. However, you can specify which intervals to export using the intervals parameter, where passing “None” will export all previously saved intervals. This is useful for re-processing long-running simulations without having to re-run them. For example, take the following global lunar bombardment simulation with quasi-Monte Carlo emplaced craters (see Simuation and Visualization for quasi-Monte Carlo file used for this simulation):
sim = Simulation(
    simdir="quasimc",
    quasimc_file="qmc_input.csv",
    gridlevel=9,
    ask_overwrite=False,
    reset=True,
    save_actions=[],
    rng_seed=252346663,
)
sim.run(age=4310, time_interval=10)
This high resolution simulation could take many hours to run, and it would be inconvenient to re-run it just to export data. In a separate script, we can open up the old data and export it all to VTK format:
from cratermaker import Simulation

sim = Simulation(
    simdir="quasimc",
    reset=False
)
sim.export(interval=None, driver="VTK")
Notice that we don’t have to supply any information about the grid, as these are stored in the old simulation’s configuration data file “cratermaker.yaml”. Upon running this, the code will output VTK files for each interval and place them in the “export” folder. Alternatively, we can also just use the built-in method to_vtk_mesh() that can convert the surface of any saved interval into a VTK mesh that can be imported directly into PyVista.
Here I’ve included a script for generating a movie of the surface evolution of the Moon, with lots of fancy graphical elements to help communicate the what is happening throughout the simulation.
from pathlib import Path

import numpy as np
import pyvista as pv
from cratermaker import Simulation
from tqdm import tqdm

simname = "quasimc"

# Set up some spacy looking lighting and background
pv.set_plot_theme("dark")
pl = pv.Plotter(off_screen=True, lighting="none", window_size=(1280, 960))
pl.enable_hidden_line_removal()
light = pv.Light()
light.set_direction_angle(30, -40)
cubemap = pv.examples.download_cubemap_space_16k()
_ = pl.add_actor(cubemap.to_skybox())
pl.set_environment_texture(cubemap, is_srgb=True)
pl.add_light(light)
pl.open_movie(simname + "-anim.mp4")


# This will rotate the Moon 1.5 times so that it starts facing the far side with South Pole-Aitken, and ends facing the near side
def rotation_angle(frac):
    return 180 + (360 + 180) * np.sqrt(frac)


# Read in the Simulation data and iterate over all saved intervals
sim = Simulation(simdir=simname, reset=False)
for interval in tqdm(
    range(sim.interval + 1),
    desc="Creating animation...",
    unit="interval",
    total=sim.interval,
):
    # Time is poorly constrained in this early epoch, so the 4310 My bp simulation start time could in reality be representative of anything from the high 4400s to the mid 4200s.
    # The amount of cratering wouldn't change, just the relationship between the number of craters and the time. once you get close to Imbrium at 3922, the simulation time is probably pretty close to accurate.
    if interval < 27:
        label = "Time: Pre-Nectarian"
    else:
        label = "default"

    pl = sim.pyvista_plotter(
        plotter=pl,
        interval=interval,
        crater_style="impacts",  # This will create a neat effect where the new craters show an "impact flash" as they are added to the plot.
        crater_type="emplaced",
        crater_color="white",
        label=label,
        time_label=True,  # Pare down the default label set to just time
        interval_label=False,
        age_label=False,
        N_label=False,
        enable_interactive=False,  # Turns off interactive key events, which will otherwise cause the impact flashes to be turned off by default
    )

    # Rotate all of the PyVista actors together using our rotation function
    for n in ["Moon", "emplaced_impacts"]:
        if n in pl.actors:
            pl.actors[n].rotate_z(rotation_angle(frac=interval / sim.interval))

    if interval == 0:
        pl.reset_camera()
        pl.view_yz()
    pl.show(auto_close=False)
    pl.write_frame()

# Add a few extra frames at the end to let the animation linger on the final state
pl.remove_actor("emplaced_impacts")
for _ in range(30):
    pl.write_frame()

pl.close()