

Note
Go to the end to download the full example code.
Fit a crater rim given a DEM and approximate crater size and location#
By David Minton
In this example, we will create a DataSurface centered on a region of the Moon that contains the Lansberg B crater. We will then supply a slightly wrong crater size and location, and use the Counting class to fit the crater rim to the DEM data.
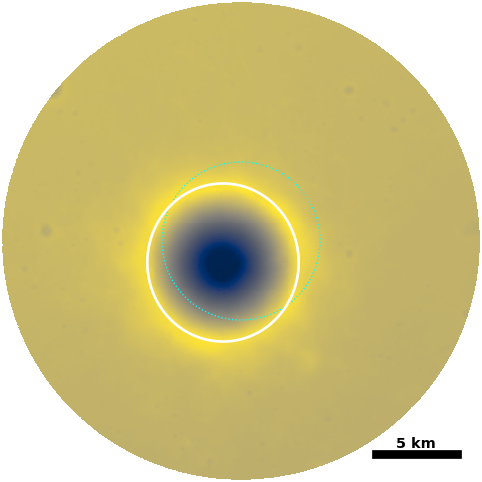
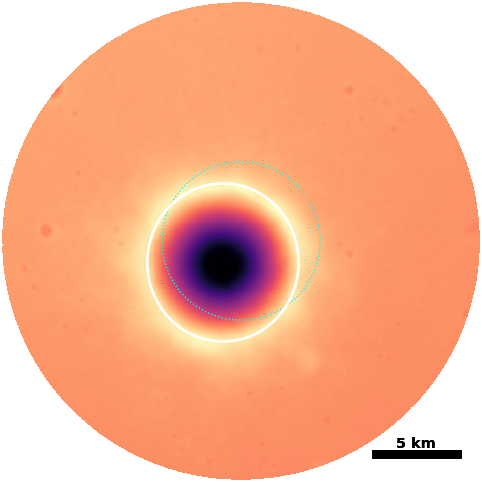
Generating a new grid.
Creating a new grid
Center of local region: (-28.099999999999994, -2.45)
Radius of local region: 14.25 km
Local region pixel size: 59.23 m
Reading DEM files:
  https://pds-geosciences.wustl.edu/lro/lro-l-lola-3-rdr-v1/lrolol_1xxx/data/sldem2015/tiles/float_img/sldem2015_512_30s_00s_315_360_float.xml
Generated 182255 points in the local region.
Generated 32323 points in the superdomain region.
Reading global DEM file:
  https://pds-geosciences.wustl.edu/lro/lro-l-lola-3-rdr-v1/lrolol_1xxx/data/lola_gdr/cylindrical/float_img/ldem_4_float.xml
ID: 761778548
Diameter: 9.500 km
Measured orientation: 0.0°
Measured location (lon, lat): (-28.1357°, -2.4926°)

transient_diameter: 7.974 km
projectile_diameter: 1.524 km
projectile_mass: 4.1722e+12 kg
projectile_density: 2250 kg/m³
projectile_velocity: 9.604 km/s
projectile_angle: 13.6°
projectile_direction: 210.3°
location (lon,lat): (-28.1000°, -2.4500°)
morphology_type: simple
time: Not set
import os

import matplotlib.pyplot as plt
import numpy as np

from cratermaker import Counting, Crater, Surface
from cratermaker.utils.general_utils import format_large_units

simdir = "simdata-5_1"
# Note, that for these examples we pass ask_overwrite=False and reset=True to the Simulation constructor. This will suppress
# prompts that ask the user if they want to overwrite existing files, which would would prevent these examples from running on their
# own when building the documentation pages. Alternatively, calling cm.cleanup(simdir) will remove all pre-existing output files.


def plot_fits(ax, surface, crater=None, plot_score=False, imagefile=None):
    """
    Plot the surface with crater fits overlaid.

    Parameters
    ----------
    ax : matplotlib.axes.Axes
        The axes to plot on.
    surface : Surface
        The DataSurface object to plot.
    crater : Crater, optional
        A Crater object containing the initial and/or fit crater rims to plot.
    plot_score : bool, optional
        Whether to plot the rimscore variable on the surface.
    imagefile : str, optional
        If provided, save the plot to this file instead of showing it.
    """
    surface.plot(show=False, style="hillshade", ax=ax)
    if crater:
        # Plot the initial guess
        crater.to_geoseries(surface=surface, split_antimeridian=False, use_measured_properties=False).to_crs(
            surface.local.crs
        ).plot(ax=ax, facecolor="none", edgecolor="cyan", linewidth=0.2, linestyle=":")

        # Plot the fit
        crater.to_geoseries(surface=surface, split_antimeridian=False, use_measured_properties=True).to_crs(surface.local.crs).plot(
            ax=ax, facecolor="none", edgecolor="white", linewidth=0.4
        )

    # Plot the rimscore
    if plot_score and "rimscore" in surface.uxds.data_vars:
        surface.plot(
            variable="rimscore",
            show=False,
            style="map",
            cmap="magma",
            ax=ax,
            imagefile=imagefile,
        )
    if imagefile is not None:
        plt.savefig(imagefile, bbox_inches="tight", pad_inches=0)
    return


# Lansberg B is a 9 km crater relatively fresh simple crater located at (28.14°W, 2.493°S).
# Start by creating a (slightly) incorrect Crater object representing our initial guess for Lansberg B.

lansberg_b = Crater.maker(diameter=9.5e3, location=(-28.1, -2.45))

# Next, we will create a DataSurface that should be large enough to encompass the correct crater rim.
surface = Surface.maker(
    surface="datasurface",
    local_location=lansberg_b.location,
    local_radius=lansberg_b.radius * 3.0,
    simdir=simdir,
    ask_overwrite=False,
    reset=True,
)

# Now refine the fit of the crater rim using the Counting class.
lansberg_b = Counting.maker(surface=surface, ask_overwrite=False).fit_rim(crater=lansberg_b, fit_ellipse=False, fit_center=True)

# If we print the crater object, we will see that the original parameters are retained, but the values from the fit are prepended by `measured_`
print(lansberg_b)

# We can plot the surface with the initial (cyan dashed line) and fitted (white solid line) crater rims overlaid.
W = int(max(1, np.ceil((2.0 * surface.local_radius) / surface.pix)))
fig, ax = plt.subplots(figsize=(1, 1), dpi=W, frameon=False)
plot_fits(ax=ax, surface=surface, crater=lansberg_b)
plt.show()

# If you want to see the score that the rim finder used, just pass `plot_score=True` to the plotting function above
fig, ax = plt.subplots(figsize=(1, 1), dpi=W, frameon=False)
plot_fits(ax=ax, surface=surface, crater=lansberg_b, plot_score=True)
plt.show()
Total running time of the script: (1 minutes 44.661 seconds)