Visualizing the surface#
Cratermaker can export the surface mesh to a VTK file, which can be visualized with tools like PyVista and ParaView. In this example, we will emplace a 500 km crater on the Moon at a location of 60° N, 45°E, and then visualize the surface mesh using Pyvista.
The simulation will generate several files in a folder called surface, including grid.nc and surf000000.nc. When exported to vtk format, a file called surf000000.vtp will also be placed in the export folder. In this example, the simulation only contains one interval, so only one file is created (see Simulation for how to run multi-interval simulations).
We can then open up the mesh in PyVista for visualization
>>> import cratermaker as cm
>>> sim = cm.Simulation(gridlevel=6)
>>> sim.emplace(diameter=500e3, location=(45,60))
>>> sim.show3d()
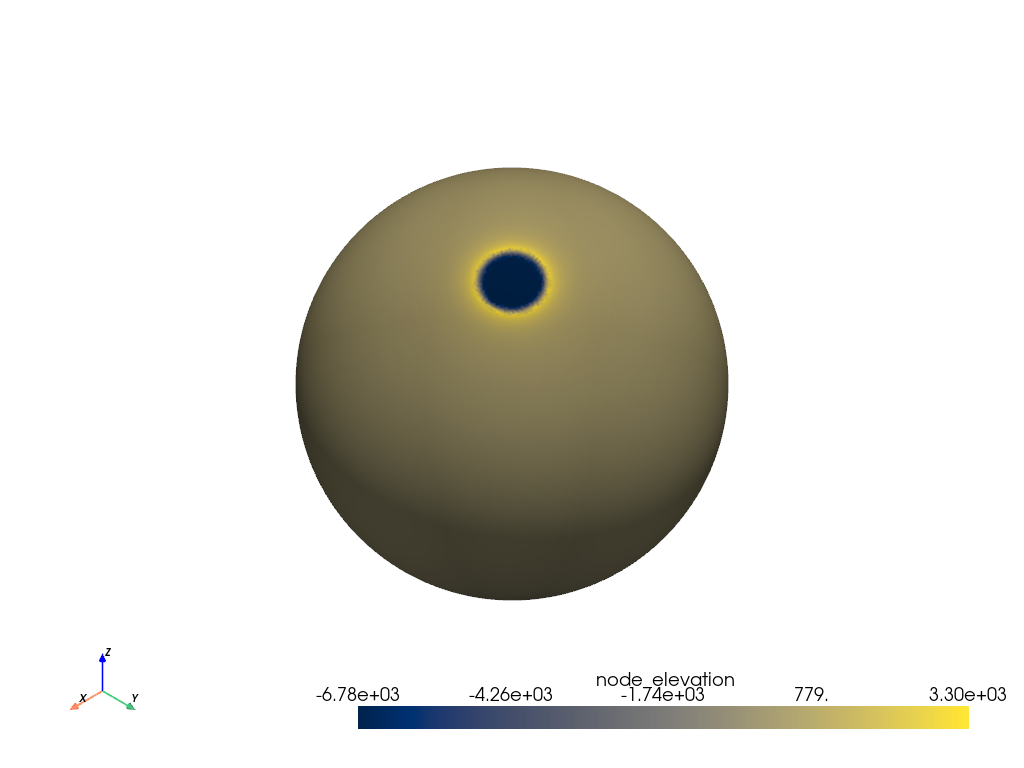
Using show3d to visualize the surface mesh.
Exporting data#
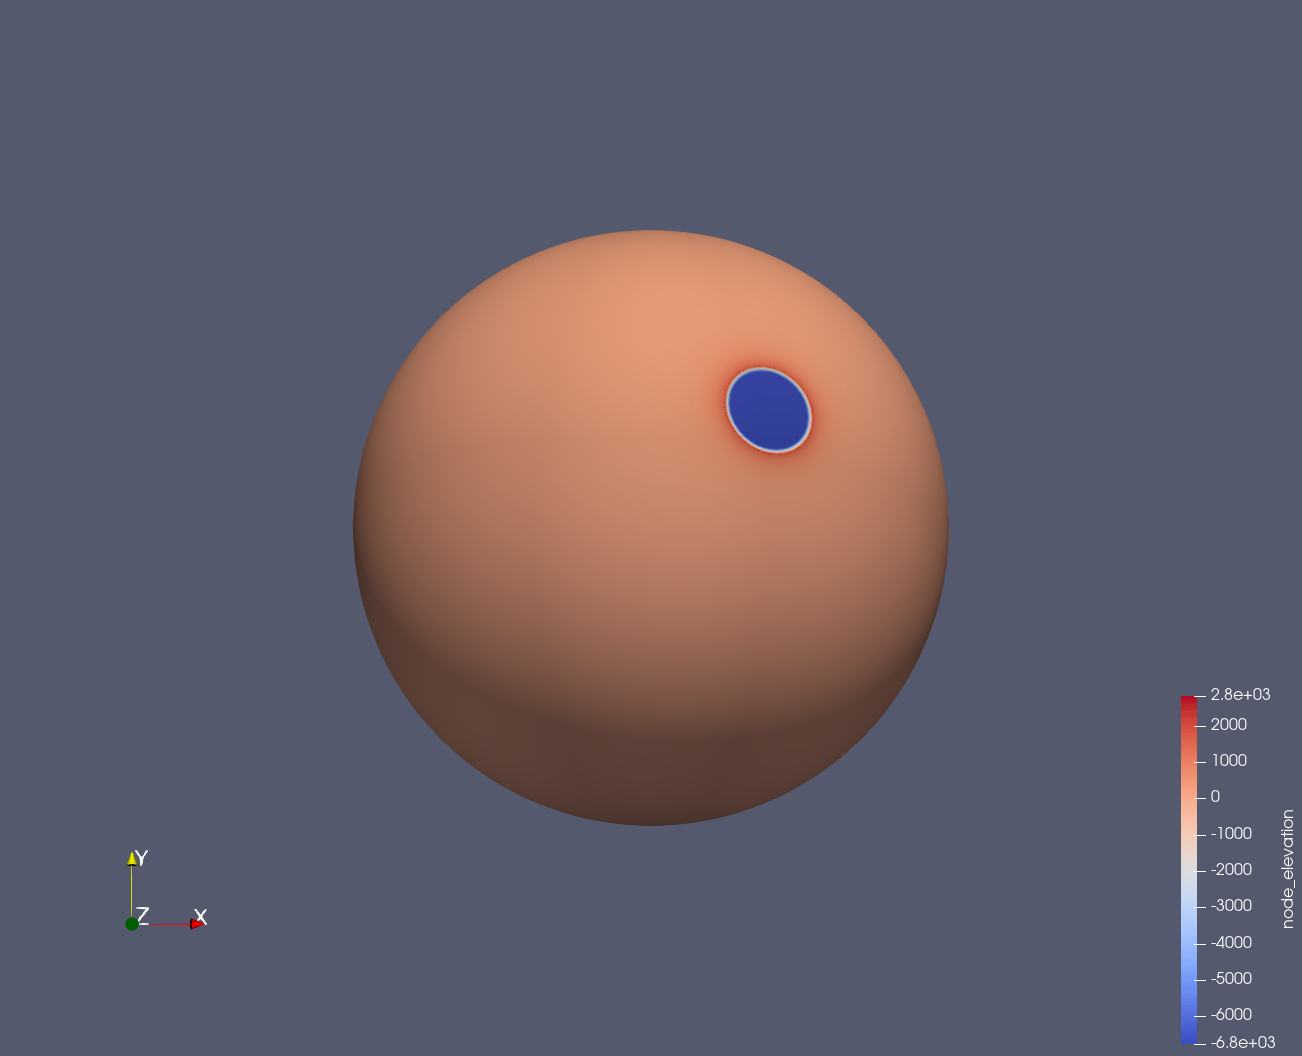
If you have old simulation data that you want to visualize it, you can make use of the Simulation.export() method. This method allows for exporting component data into multiple different formats, including “VTK’, “GeoTIFF”, “GPKG”, “Esri Shapefile”, and more, depending on the component.
For instance, to export the surface mesh to a VTK file that can be opened up with other visualization tools, like ParaView.
sim.export(driver="VTK")
ParaView can be used to visualize the surface mesh, and also to create animations of the surface evolution. For more information on how to use ParaView, see the ParaView documentation.
Exporting multi-interval data#
By default, Simulation.export() will only export the most recent interval in a multi-interval run. However, you can specify which intervals to export using the intervals parameter, where passing “None” will export all previously saved intervals. This is useful for re-processing long-running simulations without having to re-run them. For example, take the following global lunar bombardment simulation:
from cratermaker import Simulation

sim = Simulation(
    simdir="global4310-gridlevel9",
    ask_overwrite=False,
    reset=True,
    gridlevel=9,
)
sim.run(age=4310, ninterval=431)
This high resolution simulation could take many hours to run, and it would be inconvenient to re-run it just to export data. In a separate script, we can open up the old data and export it all to VTK format:
from cratermaker import Simulation

sim = Simulation(
    simdir="global4310-gridlevel9",
    reset=False
)
sim.export(interval=None, driver="VTK")
Notice that we don’t have to supply any information bout the grid, as these are stored in the old simulation’s configuration data file “cratermaker.yaml”. Upon running this, the code will output VTK files for each interval and place them in the “export” folder. Here I’ve included a script for generating an animated gif of the surface evolution:
from pathlib import Path

import pyvista as pv
from tqdm import tqdm


pv.set_plot_theme("dark")
simname = "global4310-gridlevel9"
datadir = Path(simname) / "export"

meshfiles = list(datadir.glob("surface*.vtp"))
meshfiles.sort()

pl = pv.Plotter(lighting="none", window_size=(1280, 960))
light = pv.Light()
light.set_direction_angle(30, -40)
cubemap = pv.examples.download_cubemap_space_16k()
_ = pl.add_actor(cubemap.to_skybox())
pl.set_environment_texture(cubemap, is_srgb=True)
pl.add_light(light)

pl.open_gif(simname + "-anim.gif")
for i, f in tqdm(
    enumerate(meshfiles),
    desc="Creating animation...",
    unit="frame",
    total=len(meshfiles),
):
    mesh = pv.read(filename=f).rotate_z(i, inplace=True)
    pl.add_mesh(
        mesh=mesh,
        color="grey",
        show_edges=False,
        show_scalar_bar=False,
        smooth_shading=True,
        name="Moon",
    )
    pl.view_xz()
    pl.write_frame()

pl.close()