

Note
Go to the end to download the full example code.
Manually emplace a single crater on the Moon and visualize it with PyVista#
By David Minton
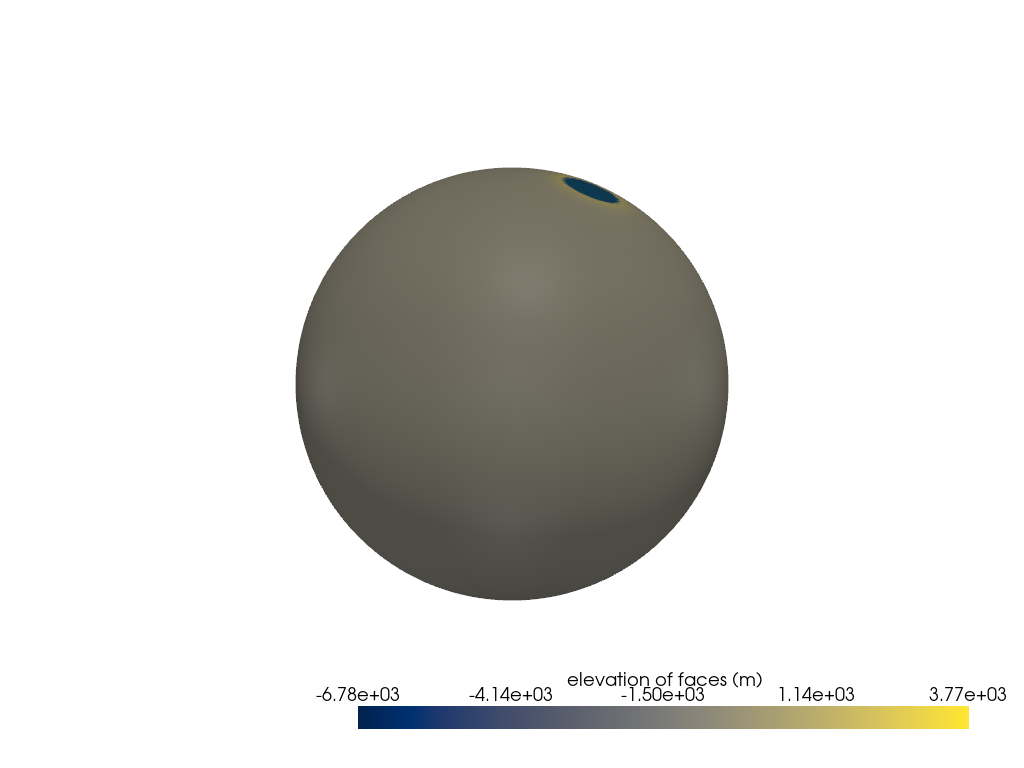
This example shows how to emplace a single large crater on the Moon using Cratermaker’s Simulation.emplace() method. The crater is defined with a specific diameter and location. The final surface is exported and visualized using PyVista.
Creating a new grid
Generating a mesh with icosphere level 6.

Queueing craters for emplacement:   0%|          | 0/1 [00:00<?, ?crater/s]
Queueing craters for emplacement: 100%|██████████| 1/1 [00:04<00:00,  4.94s/crater]


Counting craters:   0%|          | 0/1 [00:00<?, ?craters/s]


Converting xarray Dataset to Crater objects:   0%|          | 0/1 [00:00<?, ?crater/s]


Converting xarray Dataset to Crater objects:   0%|          | 0/1 [00:00<?, ?crater/s]
import cratermaker as cm

simdir = "simdata-1_1"

# Note, that for these examples we pass ask_overwrite=False and reset=True to the Simulation constructor. This will suppress
# prompts that ask the user if they want to overwrite existing files, which would would prevent these examples from running on their
# own when building the documentation pages. Alternatively, calling cm.cleanup(simdir) will remove all pre-existing output files.
sim = cm.Simulation(gridlevel=6, simdir=simdir, ask_overwrite=False, reset=True)
sim.emplace(diameter=500e3, location=(45, 60))
sim.show3d(variable_name="face_elevation", cmap="cividis")
Total running time of the script: (0 minutes 29.845 seconds)