

Note
Go to the end to download the full example code.
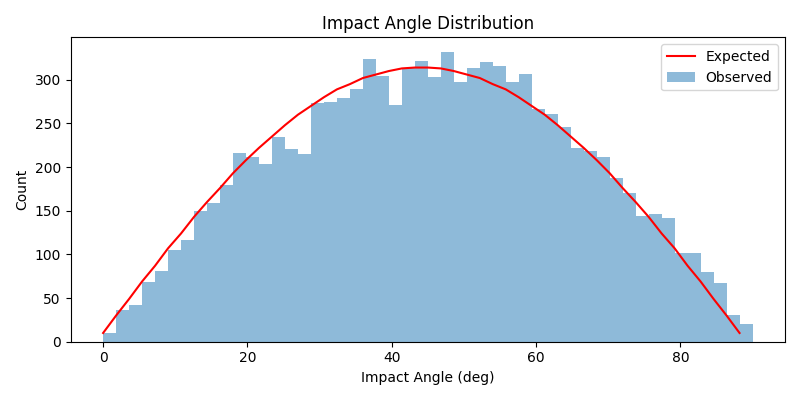
Plot random projectile impact angles#
By David Minton and Dennise Valadez
This example demonstrates how to generate and visualize random impact angles for projectiles using cratermaker.
import matplotlib.pyplot as plt
import numpy as np

from cratermaker import Projectile

# Sample data generation
proj = Projectile(mean_velocity=5000, density=3000)
size = 10000
angles = np.array([proj.new_projectile().angle for _ in range(size)])

# Number of bins
bins = 50
observed_counts, bins_ang = np.histogram(angles, bins=bins, range=(0.0, 90.0))

# Expected distribution
uniform_dist = np.linspace(0, 1, size)
transformed_angles = np.rad2deg(np.arcsin(np.sqrt(uniform_dist)))
expected_counts, _ = np.histogram(transformed_angles, bins=bins, range=(0.0, 90.0))

# Plotting distribution
fig, ax = plt.subplots(figsize=(8, 4))
ax.bar(
    bins_ang[:-1],
    observed_counts,
    width=np.diff(bins_ang),
    align="edge",
    label="Observed",
    alpha=0.5,
)
ax.plot(bins_ang[:-1], expected_counts, label="Expected", color="red")
ax.set_xlabel("Impact Angle (deg)")
ax.set_ylabel("Count")
ax.legend()
ax.set_title("Impact Angle Distribution")
plt.tight_layout()
plt.show()
Total running time of the script: (0 minutes 3.031 seconds)