

Note
Go to the end to download the full example code.
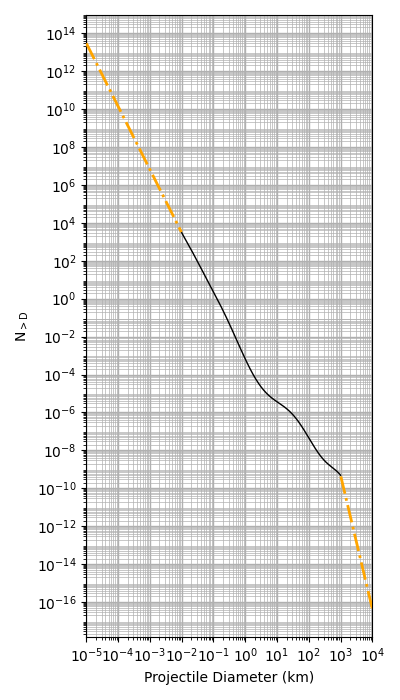
Plot the Neukum projectile CSFD#
By Austin Blevins and David Minton
In this example, we will plot the cumulative size-frequency distribution of projectiles for a 1 Gy age, which is derived from Ivanov, Neukum, and Wagner (2001) [1].
References#
import matplotlib.pyplot as plt
import numpy as np
from matplotlib import ticker

from cratermaker import Production

production = Production.maker("neukum", version="Projectile")
Dvals = np.logspace(-2, 7, num=1000)
Nvals = production.function(diameter=Dvals, age=1000.0)

fig, ax = plt.subplots(figsize=(4, 7))
Dvals *= 1e-3  # Convert from m to km
Nvals *= 1e6  # Convert from m² to km²
x_min = Dvals[0]
x_max = Dvals[-1]
ax.set_xscale("log")
ax.set_yscale("log")
ax.set_ylabel("$\\mathregular{N_{>D}}$")
ax.set_xlabel("Projectile Diameter (km)")
ax.set_xlim(x_min, x_max)
ax.yaxis.set_major_locator(ticker.LogLocator(base=10.0, numticks=20))
ax.yaxis.set_minor_locator(ticker.LogLocator(base=10.0, subs=np.arange(2, 10), numticks=100))
ax.xaxis.set_major_locator(ticker.LogLocator(base=10.0, numticks=20))
ax.xaxis.set_minor_locator(ticker.LogLocator(base=10.0, subs=np.arange(2, 10), numticks=100))
ax.grid(True, which="minor", ls="-", lw=0.5, zorder=5)
ax.grid(True, which="major", ls="-", lw=1, zorder=10)
Dlo = production.sfd_range[0] * 1e-3
Dhi = production.sfd_range[1] * 1e-3
lo = Dvals < Dlo
hi = Dvals > Dhi
inrange = (Dvals >= Dlo) & (Dvals <= Dhi)
ax.plot(Dvals[inrange], Nvals[inrange], "-", color="black", linewidth=1.0, zorder=50)
ax.plot(Dvals[lo], Nvals[lo], "-.", color="orange", linewidth=2.0, zorder=50)
ax.plot(Dvals[hi], Nvals[hi], "-.", color="orange", linewidth=2.0, zorder=50)

plt.tight_layout()
plt.show()
Total running time of the script: (0 minutes 1.471 seconds)