

Note
Go to the end to download the full example code.
Fit a crater rim given a DEM and approximate crater size and location#
By David Minton
In this example, we will create a DataSurface centered on a region of the Moon that contains the Lansberg B crater. We will then supply a slightly wrong crater size and location, and use the Counting class to fit the crater rim to the DEM data.

Generating a new grid.
Creating a new grid
Center of local region: (-28.099999999999994, -2.45)
Radius of local region: 14.25 km
Local region pixel size: 59.23 m
Reading DEM files:
  https://pds-geosciences.wustl.edu/lro/lro-l-lola-3-rdr-v1/lrolol_1xxx/data/sldem2015/tiles/float_img/sldem2015_512_30s_00s_315_360_float.xml
Generated 182255 points in the local region.
Generated 32323 points in the superdomain region.
Reading global DEM file:
  https://pds-geosciences.wustl.edu/lro/lro-l-lola-3-rdr-v1/lrolol_1xxx/data/lola_gdr/cylindrical/float_img/ldem_4_float.xml
<BasicMoonCrater>
ID: 1976317729
Name: Lansberg B
Diameter: 9.500 km
morphology_type: transitional
transient_diameter: 7.642 km
projectile_diameter: 715.8 m
projectile_mass: 4.3212e+11 kg
projectile_density: 2250 kg/m³
projectile_velocity: 9.561 km/s
projectile_angle: 58.6°
projectile_direction: 186.5°
Measured orientation: 0.0°
location (lon,lat): (-28.1000°, -2.4500°)
Measured location (lon, lat): (-28.1357°, -2.4926°)
Measured rim height: 179.0 m
Measured floor depth: -1.141 km
Ejecta region maximum radius: 256.1 km
Large enough to be emplaced on the grid: True
Face index of crater center: 111530
----------------------------------------
Crater region: <LocalSurface>
Location: -28.10°, -2.45°
Region Radius: 7.125 km
Number of faces: 46274
Number of nodes: 93366
----------------------------------------
Ejecta region: <LocalSurface>
Location: -28.10°, -2.45°
Region Radius: 256.1 km
Number of faces: 201582
Number of nodes: 403307
----------------------------------------
Rim height: 421.6 m
Rim width: 2.503 km
Floor depth: -2.176 km
Floor diameter: 2.622 km
Central peak height: None
Ejecta rim thickness: 73.60 m


Converting craters to GeoSeries polygons:   0%|          | 0/1 [00:00<?, ?crater/s]


Converting craters to GeoSeries polygons:   0%|          | 0/1 [00:00<?, ?crater/s]


Converting craters to GeoSeries polygons:   0%|          | 0/1 [00:00<?, ?crater/s]
import os
import matplotlib.pyplot as plt
import numpy as np
from cratermaker import Crater, Simulation
simdir = "simdata-5_1"
# Note, that for these examples we pass ask_overwrite=False and reset=True to the Simulation constructor. This will suppress
# prompts that ask the user if they want to overwrite existing files, which would would prevent these examples from running on their
# own when building the documentation pages. Alternatively, calling cm.cleanup(simdir) will remove all pre-existing output files.
# Lansberg B is a 9 km crater relatively fresh simple crater located at (28.14°W, 2.493°S).
# Start by creating a (slightly) incorrect Crater object representing our initial guess for Lansberg B.
lansberg_b = Crater.maker(name="Lansberg B", diameter=9.5e3, location=(-28.1, -2.45))
# Next, we will create a DataSurface that should be large enough to encompass the correct crater rim.
sim = Simulation(
surface="datasurface",
local_location=lansberg_b.location,
local_radius=lansberg_b.radius * 3.0,
simdir=simdir,
ask_overwrite=False,
reset=True,
)
lansberg_b = sim.counting.add(lansberg_b)
# Now refine the fit of the crater rim using the Counting class.
sim.counting.fit_rim(crater=lansberg_b, fit_ellipse=False, fit_center=True)
# If we print the crater object, we will see that the original parameters are retained, but the values from the fit are prepended by `measured_`
print(lansberg_b)
# We can plot the surface with the initial (cyan dashed line) and fitted (white solid line) crater rims overlaid.
sim.plot(
plot_style="hillshade",
variable_name="face_elevation",
save=False,
show=True,
include_counting=True,
observed_original_color="cyan",
observed_color="white",
close_when_done=False, # This is normally not necessary, but needed to render in the documentation build process
)
plt.show()
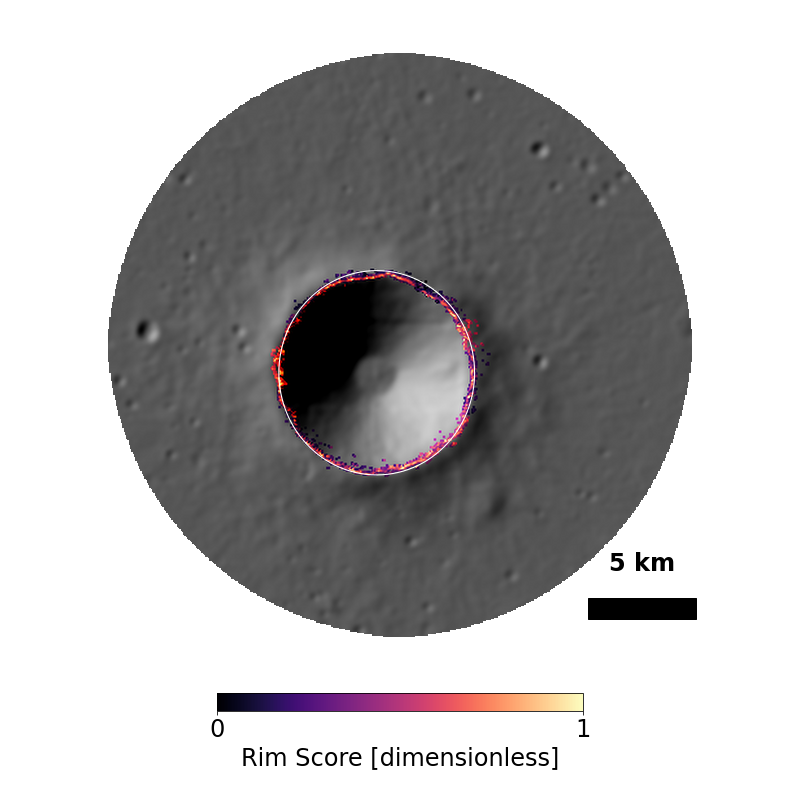
# If you want to see the score that the rim finder used, just pass `plot_score=True` to the plotting function above
sim.plot(
plot_style="hillshade",
variable_name="rimscore",
cmap="magma",
save=False,
show=True,
include_counting=True,
observed_color="white",
close_when_done=False,
)
plt.show()
Total running time of the script: (2 minutes 26.476 seconds)