

Note
Go to the end to download the full example code.
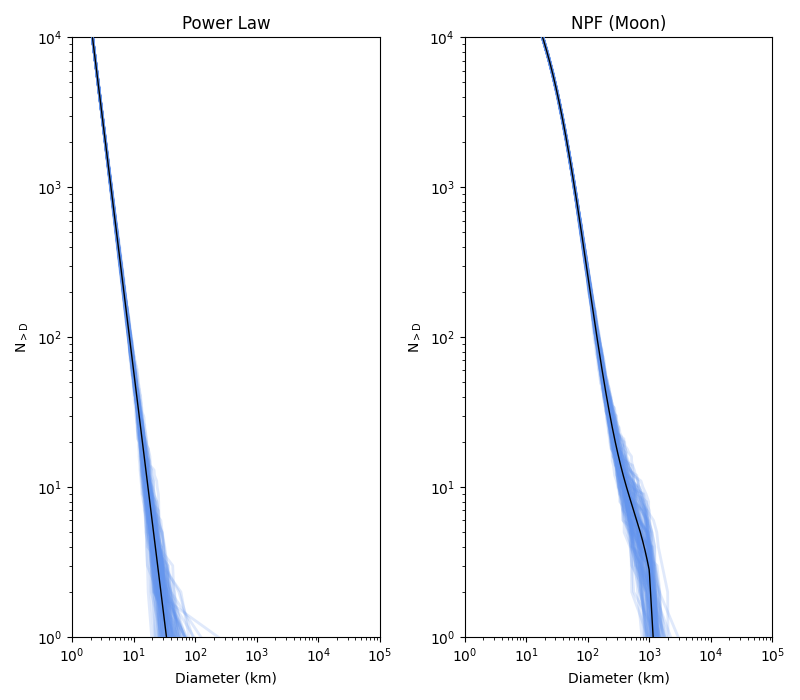
Sample a power law and lunar Neukum Production Function#
By Austin Blevins and David Minton
In this example, we use the Production.sample() method to sample populations of craters from a production function. We will sample 1000 craters from each production function and repeat this 100 times. The population samples are then plotted against the expected value given by Production.function()
import matplotlib.pyplot as plt
import matplotlib.ticker as ticker
import numpy as np

from cratermaker import Production, Target

fig, axs = plt.subplots(1, 2, figsize=(8, 7))
axes = dict(zip(["Power Law", "NPF (Moon)"], axs))

production = {
    "Power Law": Production.maker("powerlaw"),
    "NPF (Moon)": Production.maker("neukum", version="Moon"),
}

target = Target.maker("Moon")
area = 4 * np.pi * target.radius**2
age = 4100.0
x_min = 1e0
x_max = 1e5
y_min = 1e0
y_max = 1e4
diameter_range = (2e3, 10000e3)  # Range of diameters to generate in m
nD = 1000
Dvals = np.logspace(np.log10(x_min), np.log10(x_max), num=nD)
Nevaluations = 100
for name, ax in axes.items():
    ax.title.set_text(name)
    ax.set_xscale("log")
    ax.set_yscale("log")
    ax.set_ylabel("$\\mathregular{N_{>D}}$")
    ax.set_xlabel("Diameter (km)")
    ax.set_xlim(x_min, x_max)
    ax.set_ylim(y_min, y_max)
    ax.yaxis.set_major_locator(ticker.LogLocator(base=10.0, numticks=20))
    ax.yaxis.set_minor_locator(ticker.LogLocator(base=10.0, subs=np.arange(2, 10), numticks=100))
    ax.xaxis.set_major_locator(ticker.LogLocator(base=10.0, numticks=20))
    ax.xaxis.set_minor_locator(ticker.LogLocator(base=10.0, subs=np.arange(2, 10), numticks=100))

    # Plot each sampled population Monte Carlo style
    for i in range(Nevaluations):
        Dsampled, _ = production[name].sample(age=age, diameter_range=diameter_range, area=area, compute_time=False)
        Dsampled = np.sort(Dsampled)[::-1]
        Nsampled = range(1, len(Dsampled) + 1)
        ax.plot(
            Dsampled * 1e-3,
            Nsampled,
            "-",
            color="cornflowerblue",
            linewidth=2.0,
            zorder=50,
            alpha=0.2,
        )

    # Plot the production function (the expected values)
    Nvals = production[name].function(diameter=Dvals * 1e3, age=age)
    Nvals *= area  # convert from per unit area to total number
    ax.plot(Dvals, Nvals, "-", color="black", linewidth=1.0, zorder=50)

plt.tick_params(axis="y", which="minor")

plt.tight_layout()
plt.show()
Total running time of the script: (0 minutes 16.777 seconds)