

Note
Go to the end to download the full example code.
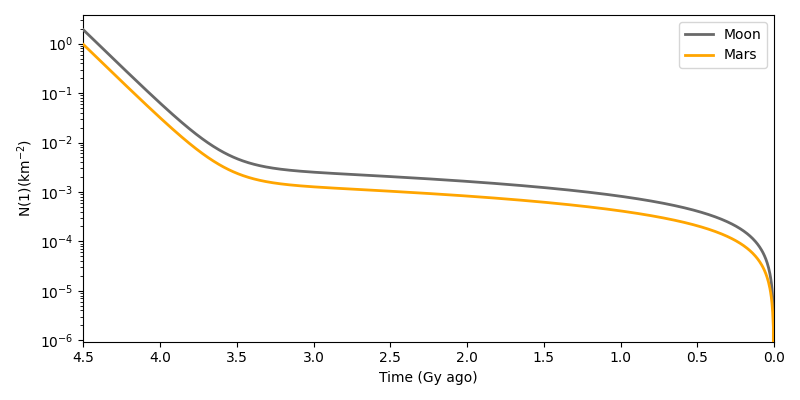
Plot the NPF Chronology function for the Moon and Mars#
By Austin Blevins and David Minton
Here we plot the chronology component of the Neukum production function for the Moon and Mars. The chronology function is the number of craters per unit area per unit time, which is a function of crater diameter and age. The plot shows the number of craters per square kilometer per million years as a function of time for a 1 km crater.
import matplotlib.pyplot as plt
import numpy as np

from cratermaker import Production

moon = Production.maker("neukum", version="Moon")
mars = Production.maker("neukum", version="Mars")
age_vals = np.linspace(4.5e3, 0.0, num=1000)

N1_moon = moon.chronology(age=age_vals)
N1_mars = mars.chronology(age=age_vals)

fig, ax = plt.subplots(figsize=(8, 4))
ax.set_yscale("log")
ax.set_ylabel("$\\mathregular{N(1) (km^{-2})}$")
ax.set_xlabel("Time (Gy ago)")
ax.set_xlim(4.5, 0)

# Convert age from My to Gy and N1 from m² to km² for plotting
ax.plot(
    age_vals * 1e-3,
    N1_moon * 1e6,
    "-",
    color="dimgrey",
    linewidth=2.0,
    zorder=50,
    label="Moon",
)
ax.plot(
    age_vals * 1e-3,
    N1_mars * 1e6,
    "-",
    color="orange",
    linewidth=2.0,
    zorder=50,
    label="Mars",
)

ax.legend()

plt.tight_layout()
plt.show()
Total running time of the script: (0 minutes 0.677 seconds)